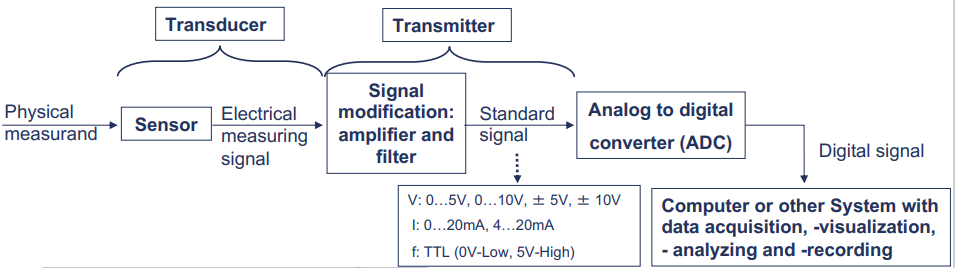
Measuring System
Physical measurand → Sensing element → Signal modification subsystem → Indicator or Recorder
温度计: 温度 T → 水银/酒精 → 玻璃管,玻璃泡…组成了温度计 → 读数
Test Stands
比如 在研究上运用的NI的设备和LabVIEW,在工业上运用PLC系统
Terms
True & Measurement Value
- 永远想得到但是永远得不到的True Value, 只有估计值
- 在Measurement Value 和True Value之间总是有误差measurement error
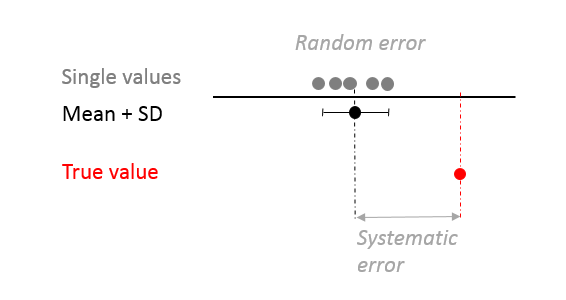
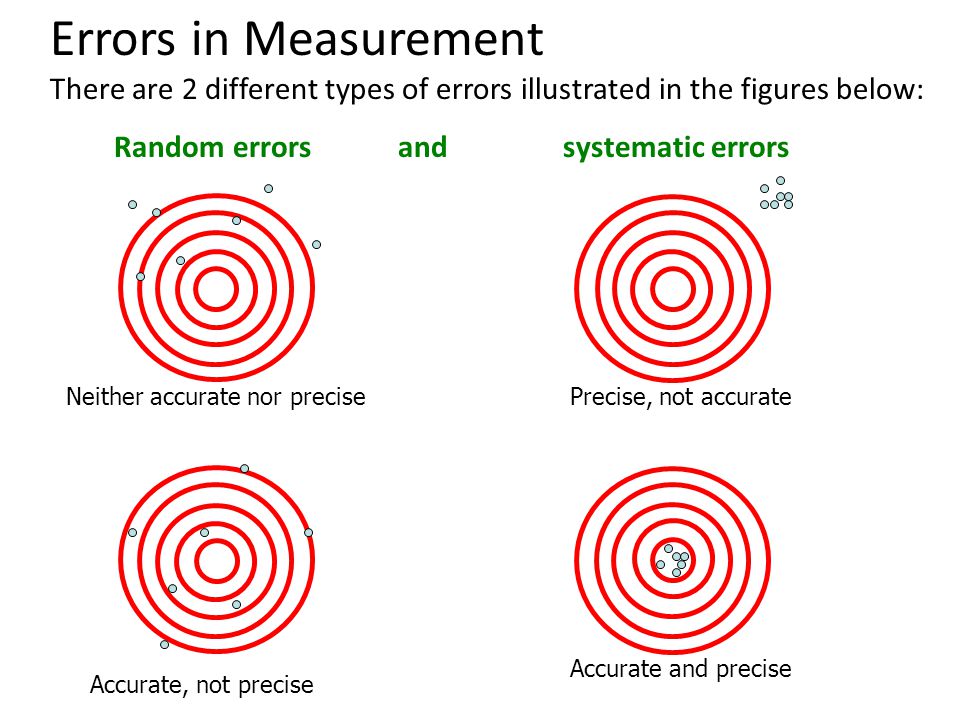
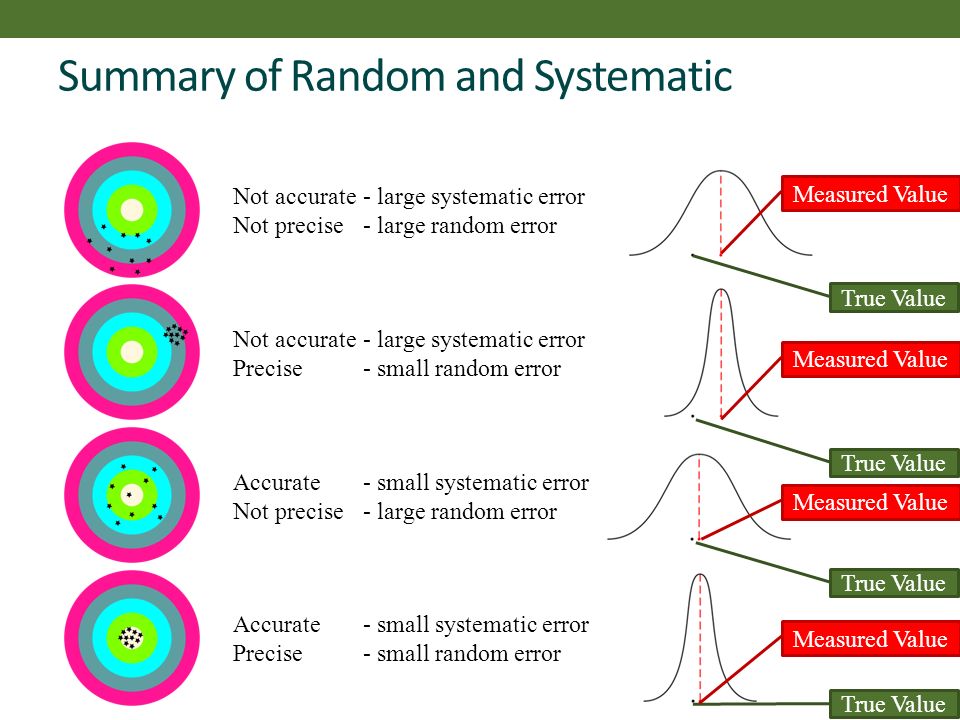
Random & Systematic Error
error = measured value - true value: 不只是测量系统自身的问题,是整个测量过程带来的。
-
random error caused by the lack of repeatability
= reading - average of reading
每次测量都会有小误差(比如 刻度尺读数)= 不精确
改善:多次重复取平均等。
-
systematic error consistent repeatable
= average of reading - true value
平均测量值和实际值的误差 = 不准确
改善:提升系统。
-
gradient / gain error 斜率
-
offset error 偏移
-
nonlinearity
-
hysteresis 迟滞现象/滞回
增加input和减少input的output变化是不同的。下图是理想化橡皮筋伸缩的情况:橡皮筋不完全满足线性弹簧的胡克定律(F=kx)。经典的滞回还有 磁滞 和 施密特触发器 Schmitt Trigger。

-
response sensitivity
-
measuring range
-
Measurement Range
- span = 上界-下届
- 超过range的测量值不是有效的测量值
- 每个测量系统都有特定的测量界限
Accuracy → Systematic Error
-
测量值和实际值的接近度
-
通常测量系统或传感器的生厂商定义了产品的不准确率 ±0.01mA之类的
-
不准确率/测量误差 通常被描述成 percentage of full scale (% FS), 少数情况是 percentage of reading (% RD)
区别:Accuracy: % Full Scale vs. % Reading form massflow-online.com
- 全尺度误差:不管测量值是多少,始终有全尺度*百分数的固定误差
- 读数误差:存在是读数*百分数的误差
- 比如 一个测量范围是 5kg的秤 标注 10%FS的情况,显示2kg的东西实际可能是1.5-2.5kg;标注 10%RD的情况,显示2kg的东西实际是1.8-2.2kg
Precision → Random Error
- 高精确率意味着:输入不变,输出不变;即相同条件下,每次测量都能获得相同值
- 与准确率无关
Resolution
定义了输入可以被分辨/测量/显示的最小变化, 比如厨房秤 1g
Sensitivity

- ratio 输入变化的比例 和输出变化的比例相同
- 线性系统比例固定
Uncertainty
1 Dimension
-
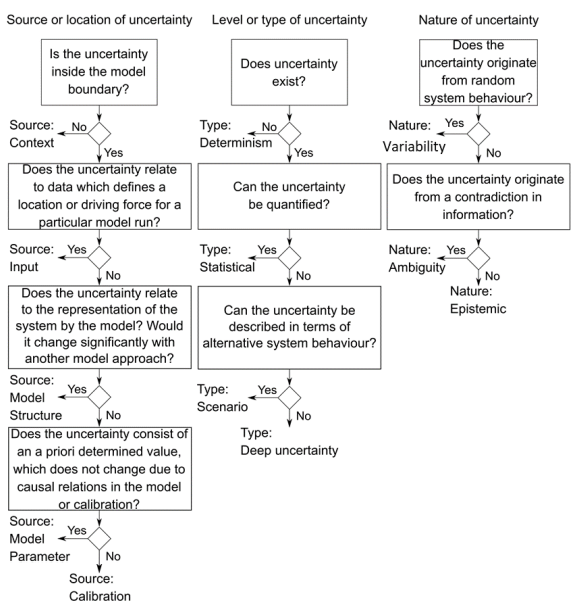
Type [1]
如何描述这个不确定性
-
Determinism 确定
-
Statistical
-
Scenario
-
Qualitative
-
Recognized Ignorance
-
Indeterminacy
-
Total Ignorance
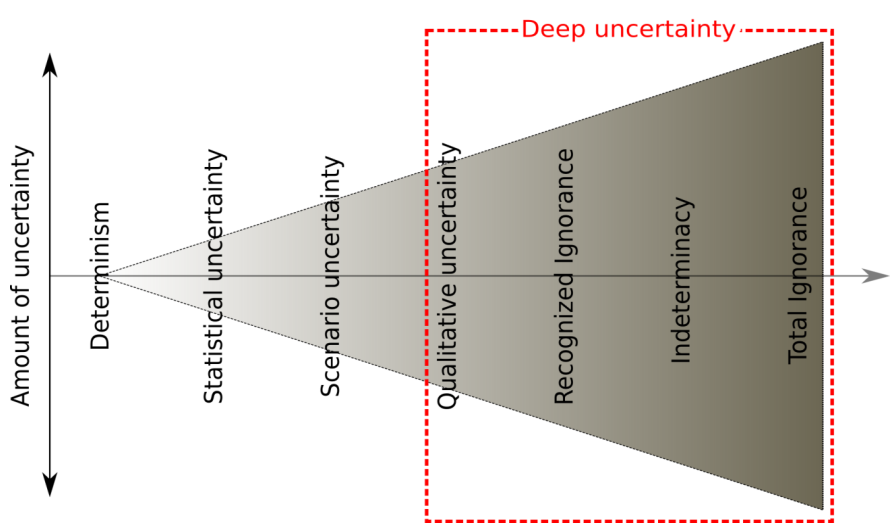
越顶层的不确定性数量越少也更容易被描述,比如统计上的不确定性。
-
-
Nature
- Epistemic - 系统性不确定性/认识性不确定性,不能知道系统的状态/忽略系统的影响因素。
- Variability - 自然属性不能通过操作减少。比如,不能预测投硬币的正反。
- Ambiguity - 不同的信息来源
-
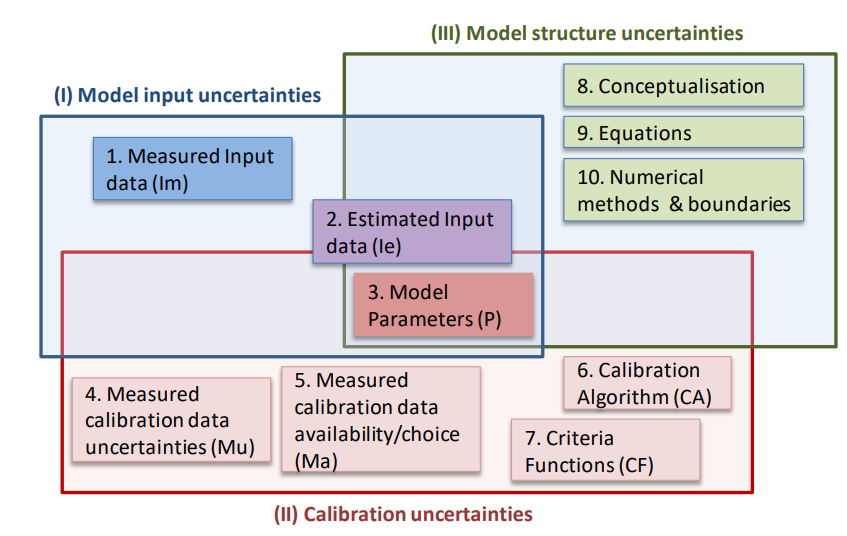
Location [3]
-
model input data
-
model parameters
-
calibration
-
model structure
-
describe uncertainties [2]
-
2 Model Calibration 校准
- 就像机器人状态估计里一样,我们有测量数据(比如轮子上的转速传感器)和作为标准的数据[观测数据](比如激光传感器(位移))。再比如,测量数据是降水量,标准数据是径流。通过1234循环:1 用测量数据拟合模型;2 计算出估计的标准数据;3 估计的标准数据和实际的标准数据进行比较,比如通过最小平方误差等方法;4 得到参数,然后回到1 调整模型 。最后得到最好的参数和模型。
- Model
- Calculation
- Comparison
- Parameter
-
不同的目标方程
在3 Comparison中可以使用不同的目标方程:
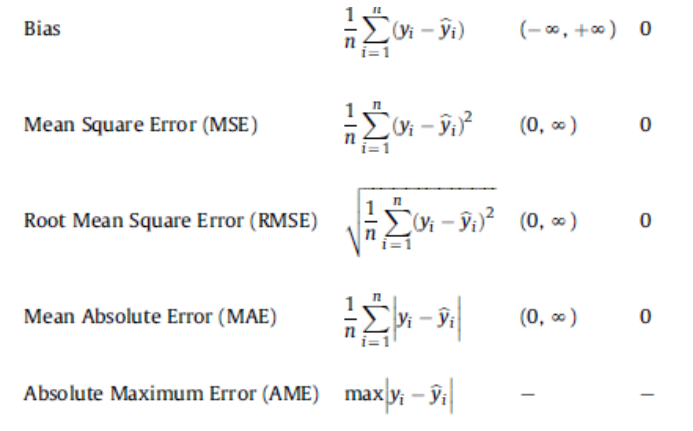
要选择合适的,可能的话运用多个,不要单独使用R2,结合图像选择。
-
自动校准算法
- Gradient method
- Levenberg-Marquardt-Algorithm
- Gauss-Newton-Method
- Genetic algorithm
-
人工校准(以降水量和径流为例)
- Time of maximum flow
- Maximum flow caused by a rain event
- Shape of flow curve
- Total volume of a rain event
-
验证 Validation
类似机器学习解决过拟合Over-fitting,这里叫Over-Parametrization
3 Sensitivity Analysis
-
Local Sensitivity Analysis
每次只改变一个参数,其他保持不变,观察模型变化
-
Global sensitivity Analysis
所有参数一起改变,蒙特卡罗采样
Equifinality 几组同一输入下,输出不变的参数
-
No correlation between parameters
-
Measure for Sensitivity: Sobol’ indices
那个参数对模型影响更大
参数的选择范围 bandwidth会影响结果
-
例子:Pollutant Wash-off model
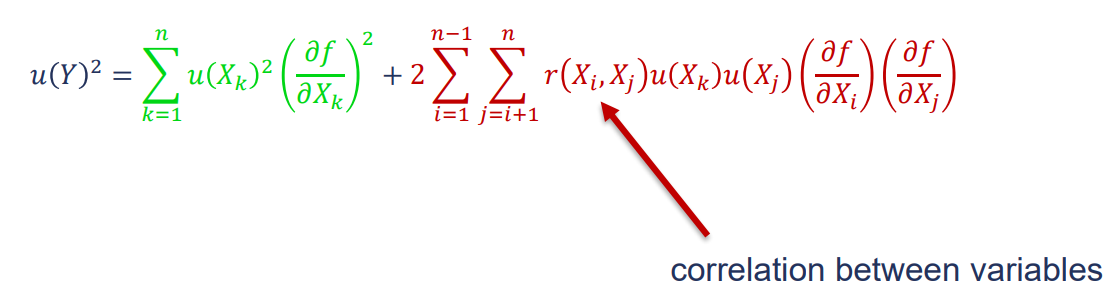
4 误差传播 Propagation
- Law [4][5]
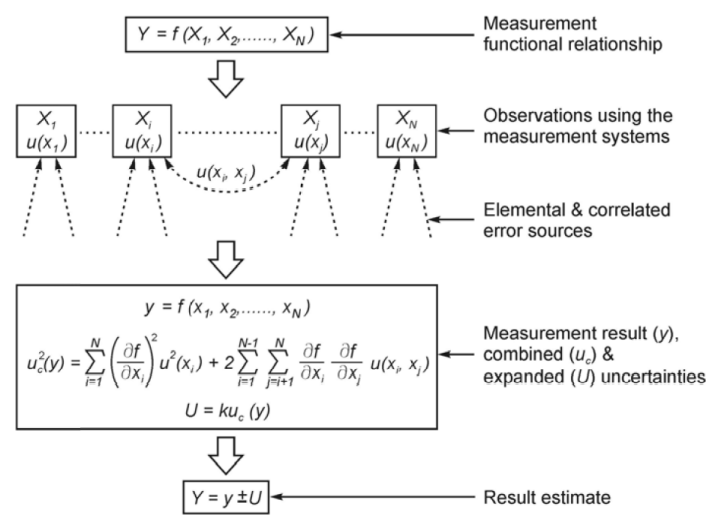
但对于几百个输入的模型并不试用
-
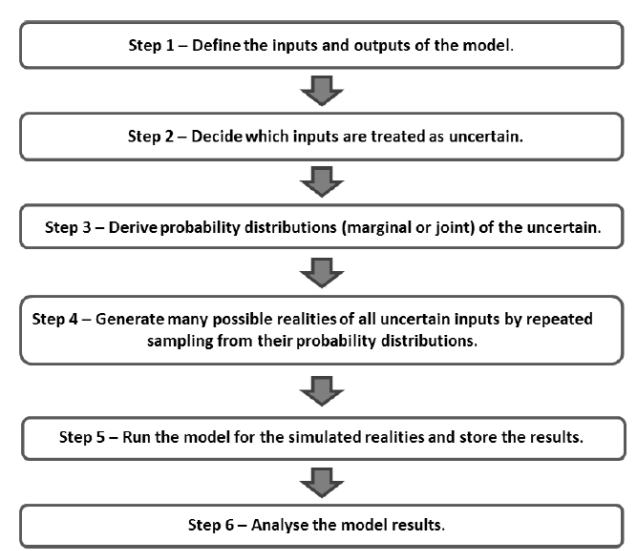
实际 Analysis Step [6]
-
step2 不用把所有input当作uncertainty,选择影响大的: sensitive高 + 尺度大 Magnitude/Bandwidth范围大
-
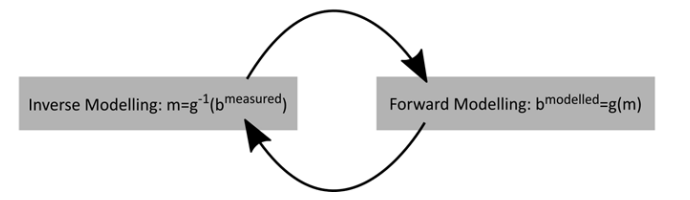
step3/4 用Inverse modelling 贝叶斯 / Forward modelling 蒙特卡洛
-
5 Handling of Uncertainty
Statistical analysis
- Model: accurate?
- Measurement: devices?
- Reality: Something happened?
Scenario analysis
- Predictive / Forecast / what if
- Explorative / Testing of possibilitie / what is possible
- Normative / Goal aspiration / how
[1] Source: Tscheikner-Gratl et al. (2017): QUICS - D6.7 A Framework for the application of uncertainty analysis. https://doi.org/10.5281/zenodo.1240926
[2] Source: Warmink et al. (2010). Identification and classification of uncertainties in the application of environmental models. Environ. Model. Softw. 25, 1518–1527. https://doi.org/10.1016/j.envsoft.2010.04.011
[3] Source: Deletic et al. (2012). Assessing uncertainties in urban drainage models. Phys. Chem. Earth 42–44, 3–10. https://doi.org/10.1016/j.pce.2011.04.007
[4] Source: Bertrand-Krajewski, J.-L., Ribeiro, A.S., Almeida, M. do C., 2011. Evaluation of uncertainties in measurements (Deliverable No. 3.1.6), PREPARED.
[5] Source: Pons (2020): Uncertainty and Sensitivity in Practice; Water and Wastewater Systems Advanced Course
[6] Source: Heuvelink, G.B.M., Cecinati, F., Lepot, M., Moreno-Rodenas, A., Sawicka, K., Torres, A., 2017. Guidelines and manuals for end-users on uncertainty propagation analysis and sampling designs (Deliverable No. 6.2), QUICS. Zenodo